

Turkic-Speaking Countries Orthopaedics & Traumatology International Congress
Movement Quality After Intra-articular Injections
Comprehensive Real-World Evaluation Using Markerless Motion Analysis in Knee Osteoarthritis
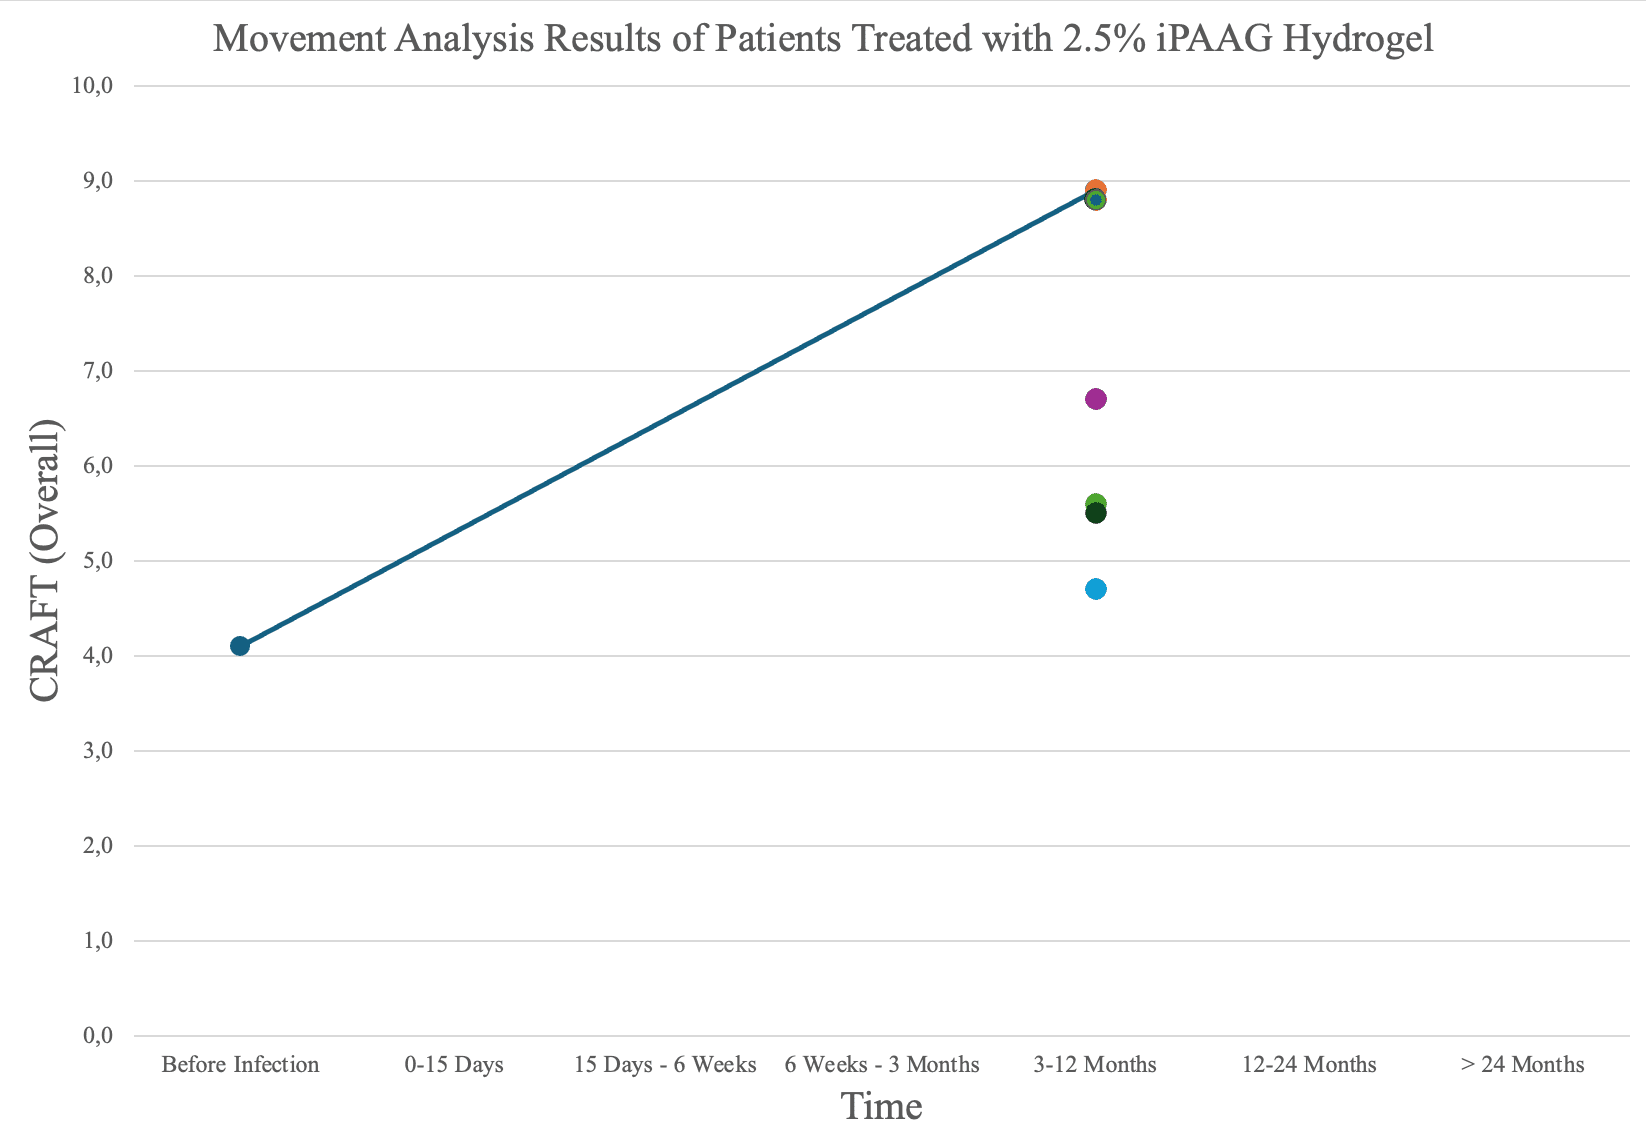
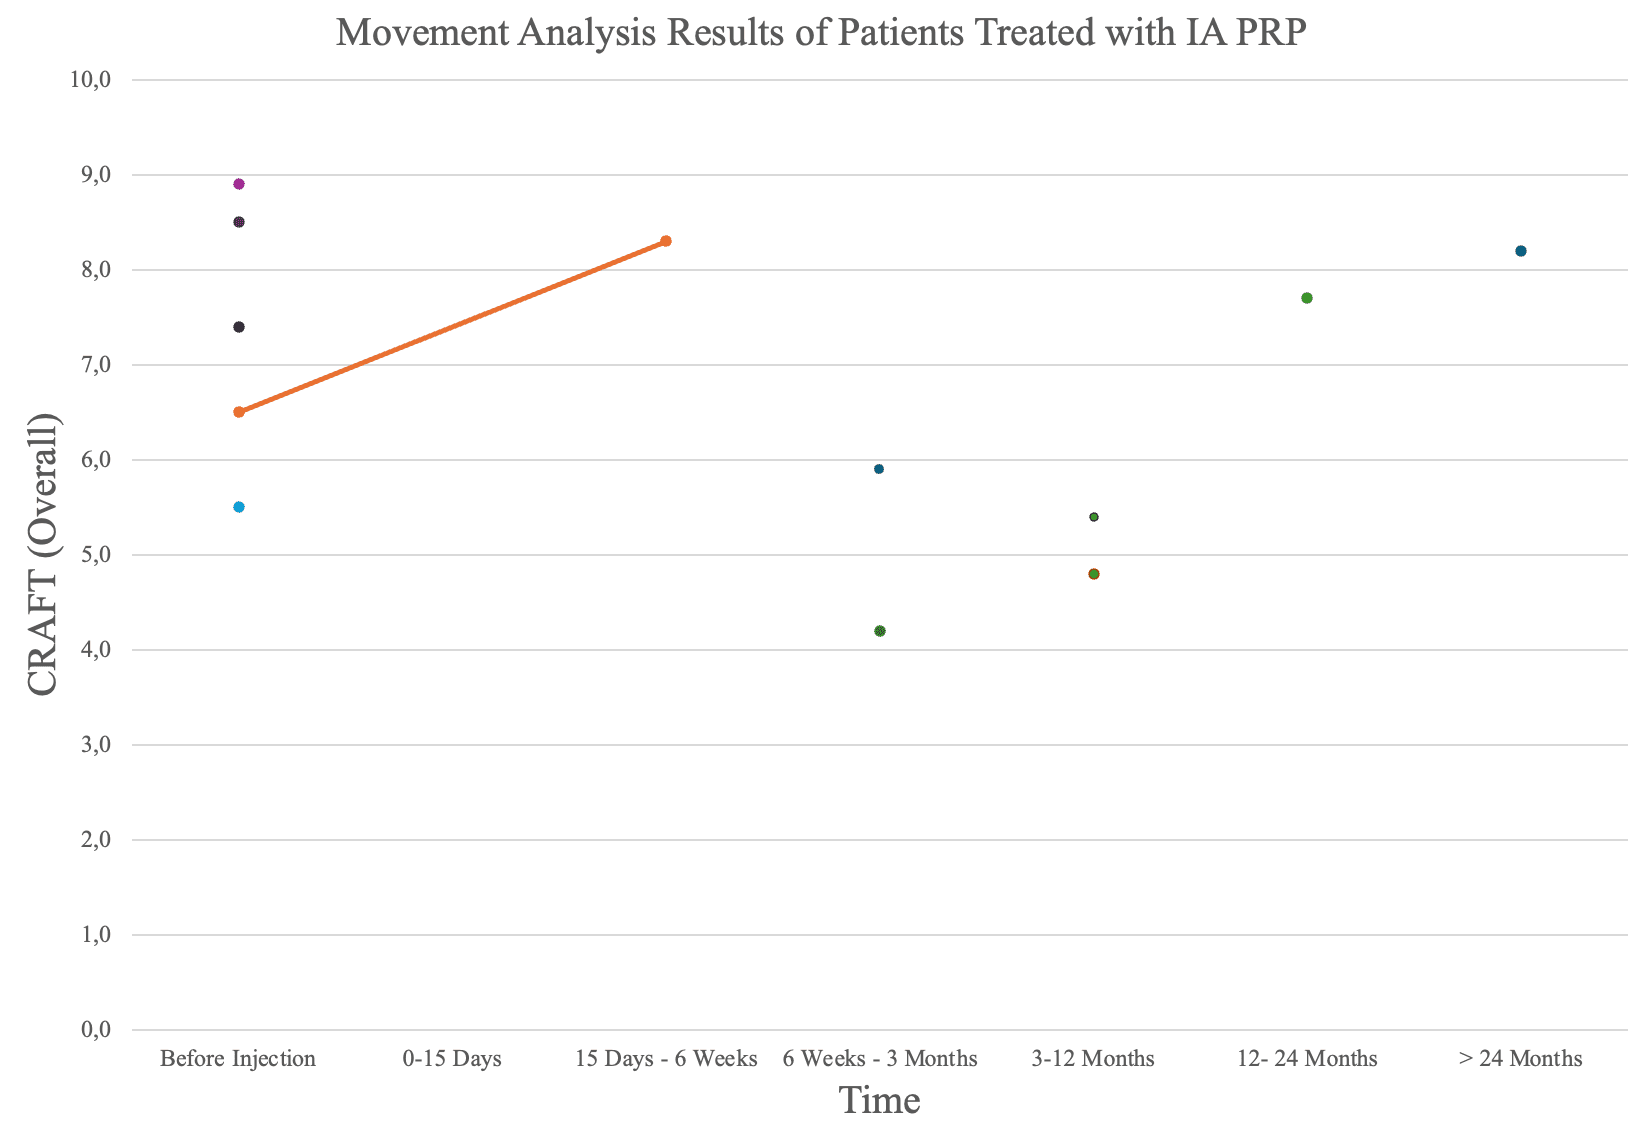
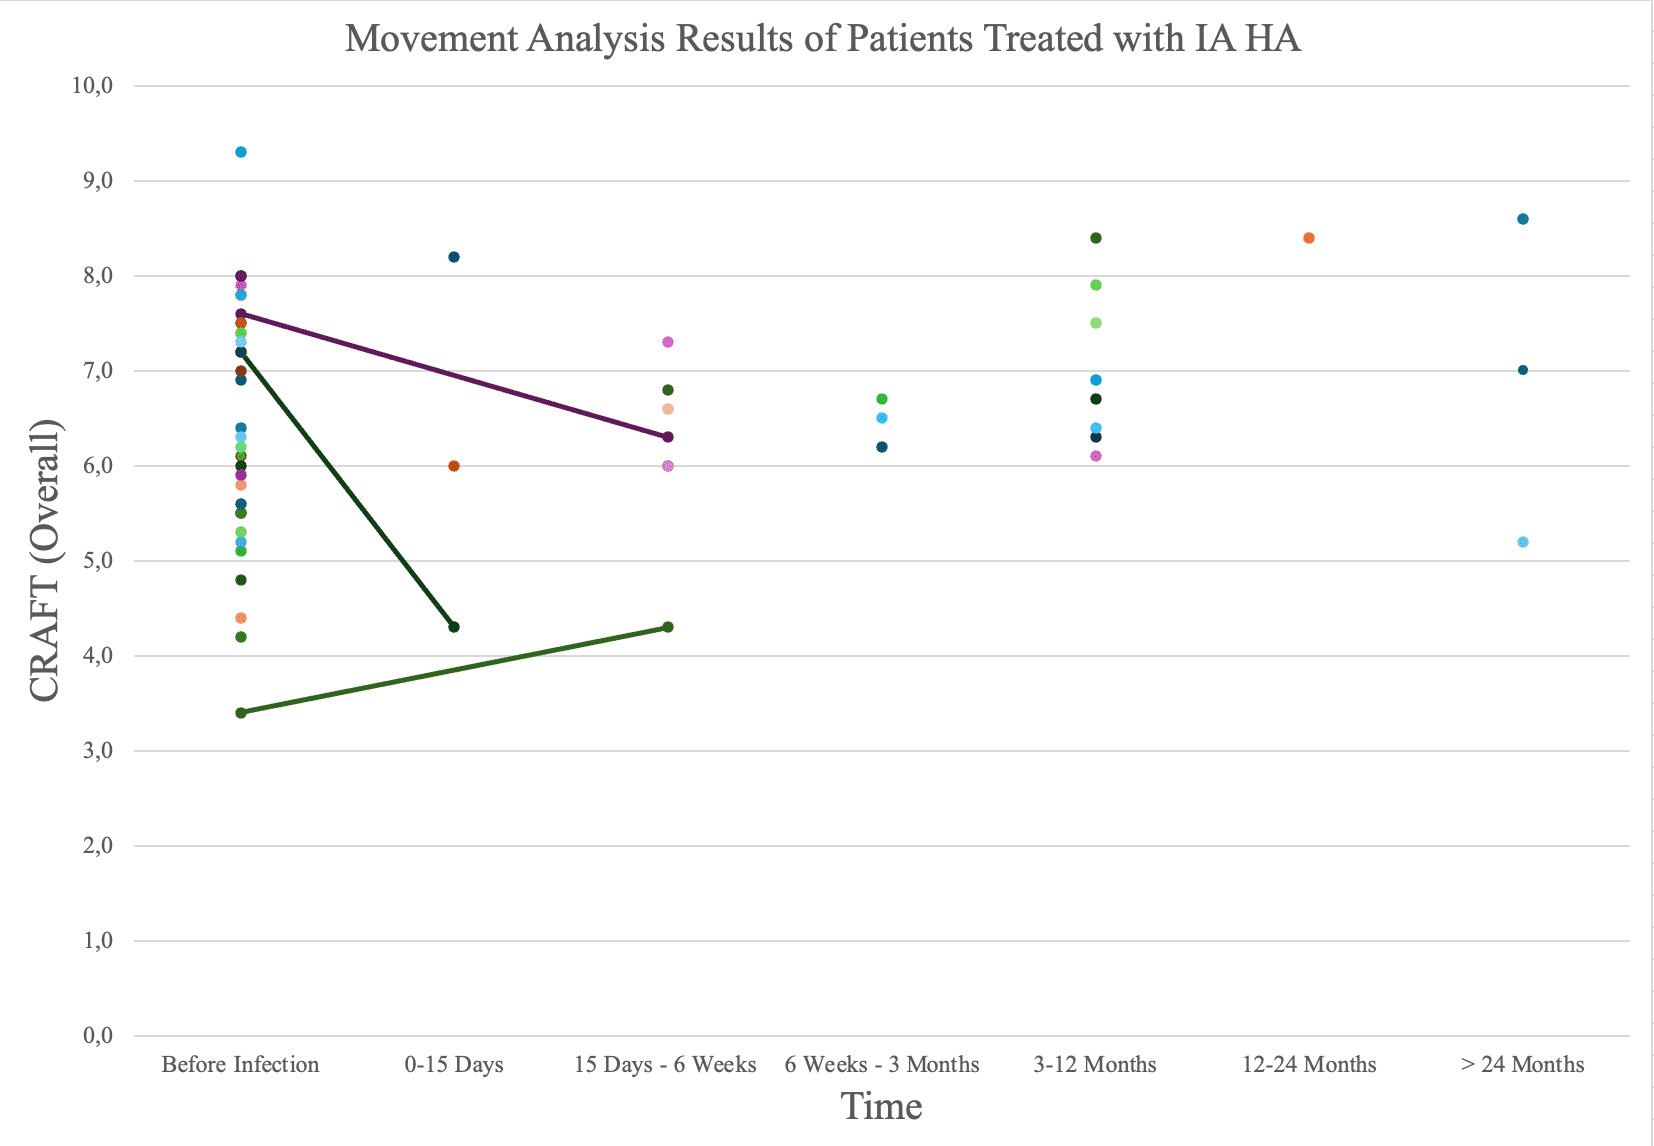
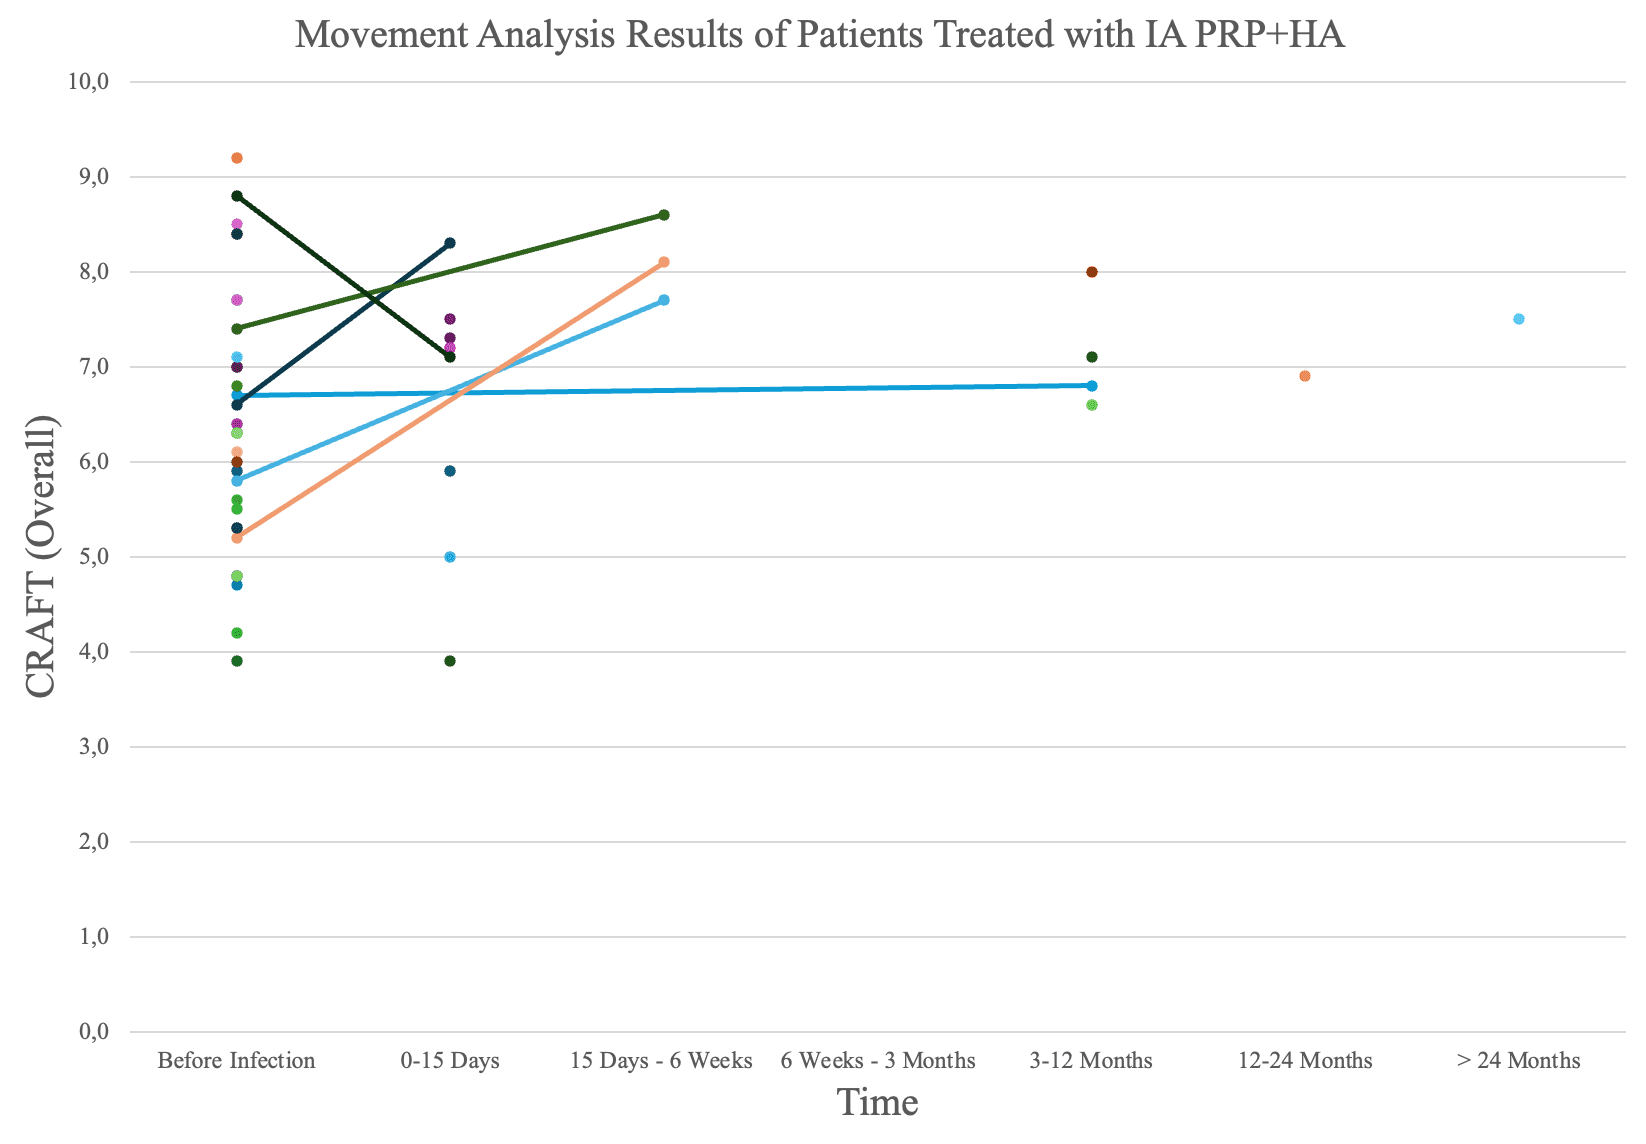
A real-world case series of 122 patients with knee osteoarthritis assessed with MAI Motion after iPAAG, PRP, hyaluronic acid or PRP+HA injections. C.R.A.F.T. movement-quality scores rose in every group, from baselines of 4.1–7.4 to peaks of 6.7–8.9, with the clearest gains in the first 4–6 months.
Where and when
- Presented
Turkic-Speaking Countries Orthopaedics & Traumatology International Congress
TOTBİD and the Azerbaijan Orthopaedic Society
September 2026Baku Marriott Hotel Boulevard, Azerbaijan
Authors
- Selin Demirel Mısırlı — Presenting author, Hacettepe University, Ankara
- Feza Korkusuz — Co-author, Hacettepe University, Ankara
- Paul Lee — Co-author, MSK Doctors, Sleaford
- Tanvi Verma — Co-author, MSK Doctors, Sleaford
Abstract: SB-040

Presenting author
Dr Selin Demirel Mısırlı
Hacettepe University, Department of Sports Medicine, Ankara, Türkiye
Themes
Scientific Focus
Knee osteoarthritis brings progressive pain, reduced mobility and impaired movement quality, and intra-articular treatments such as platelet-rich plasma (PRP), hyaluronic acid (HA), 2.5% polyacrylamide hydrogel (iPAAG) and combinations are increasingly used to improve joint function.
Yet the question clinicians struggle to answer in routine practice is not whether the patient feels less pain but whether they actually move better. This study asked that question with MAI Motion, an AI-based markerless system that turns standard video into three-dimensional movement data and scores movement quality from 0 to 10 on the C.R.A.F.T. framework: control, repetition, asymmetry, flow and rotational dynamics (twist).
Patients receiving iPAAG (n=9), PRP (n=11), HA (n=59) or PRP+HA (n=43) were assessed during routine outpatient visits at variable intervals from before injection to more than 24 months afterwards. Because baseline data were limited, the analysis was descriptive, summarising absolute values and longitudinal change.
Results
| Follow-up | 2.5% iPAAG (n=9) | PRP (n=11) | HA (n=59) | PRP+HA (n=43) |
|---|---|---|---|---|
| Before injection | 4.1 | 7.4 | 6.5 ± 1.2 | 6.5 ± 1.4 |
| 0–15 days | — | — | 6.2 ± 2.0 | 6.5 ± 1.5 |
| 15 days – 6 weeks | — | 8.3 | 6.2 ± 1.0 | 8.1 ± 0.5 |
| 6 weeks – 3 months | — | 5.1 | 6.5 ± 0.3 | — |
| 3–12 months | 7.3 ± 1.7 | — | 7.0 ± 0.8 | 7.1 ± 0.6 |
| 12–24 months | — | — | 8.4 | 6.9 |
| > 24 months | — | — | 6.9 ± 1.7 | 7.5 |
Table 1. Overall C.R.A.F.T. scores (0–10) across treatment groups and follow-up time points. Values are mean ± SD or single observations; assessments were performed at variable intervals from pre-injection to more than 24 months. Dashes mark time points with no available measurement.
A · 2.5% iPAAG hydrogel
B · PRP
C · HA
D · PRP + HA
Why It Matters
C.R.A.F.T. scores increased over time in every treatment group. Baselines ranged from 4.1 to 7.4 and peak values reached 6.7 to 8.9, an improvement of roughly 30–75%, with the most pronounced gains inside the first 4–6 months.
Individual trajectories rose progressively, with some variability at later time points, and despite heterogeneous follow-up the longitudinal plots showed consistent positive trends.
The authors are careful about what this does and does not show: it is a real-world observation, not evidence of causation, of superiority between treatments, or of a generalisable effect size, because follow-up timing was uneven, baseline measurement was limited and the analysis is descriptive.
What it does show is that movement quality can be tracked in routine clinics, so treatment can be monitored by how a patient moves as well as by how they feel.
Next in the programme
Biomechanical Comparison of Sit-to-Stand and Squat Using the CRAFT Framework and MAI Motion Analysis
BOA Annual Congress 2025 · September 2025